The huge marketing effort behind “Doctor Strange in the Multiverse of Madness” set my expectations very high … and it delivered. It was an action packed story with few surprises, thanks to all the leaks.
I felt the same way for the Tableau Conference 2022 – back after 2.5 years – and it delivered! I am particularly excited that data literacy was a main theme. As you may know, my company, DecisionViz, helps clients scale data literacy.
The keynote was moving right along to announcing a new feature – “Data Stories for Tableau” (no leaks about this). Tableau was going to make a big statement and I was anxious to see how they might bring the widely-various forms of data stories together.
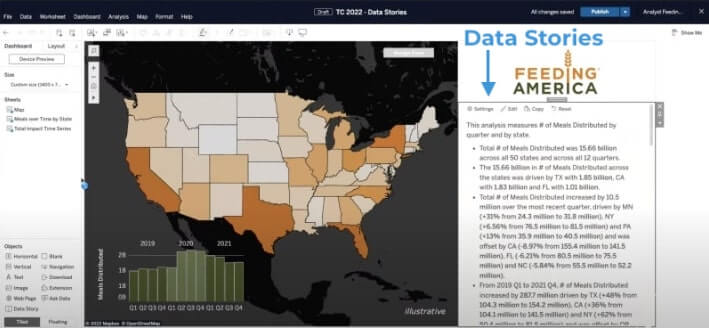
Data Stories is auto-generated text based on the underlying data in the charts. It applies the technology from Narrative Science, whom they recently acquired.
Tableau just anchored the concept of a data story to paragraphs filled with metrics and facts.
I was disappointed and confused 😞 This adds more ambiguity into what people consider a story. This is not a story that takes the reader through the data; rather it places a heavy burden on the reader to absorb that data and make connections.
Even if the text is insightful, volumes of text conflict with the point of visualization. I do like that the text updates based on interactions with charts. But overall, this lacks the thoughtfulness Tableau puts into products.
Will you use “Data Stories for Tableau?” Comment and let me know your opinion.
Best,
Lee
Rewriting How People See Data™
PS On a personal level, it was prideful to see Feeding America as a showcase customer. I ran workshops (pro bono) for their Data Fellows a few years ago. Here’s a video of me and Stephanie Zidek (Feeding America) from Tableau Conference 2018
PPS I’ve also volunteered packing food at my local food bank; it’s a great experience.. Find your local foodbank
Frustrated By Low Dashboard Adoption?
Learn how to transform passive charts into action-oriented visuals.
