
On a morning walk in my neighborhood, this license plate caught my eye.
It reminded me of a saying I’ve always loved:
“If I had more time, I could have written less.”
Sadly, this excuse is common in our work of data visualization and storytelling.
We are overrun by dashboards crammed with charts, violate best practices that are a few mouse clicks away, and burden the reader to find insights.
What’s stopping us from writing better in less time?
Brevity has never been more important to maintain our professional and personal sanity. tl;dr (too long; didn’t read) is commonplace behavior.
If you want to practice brevity, put these three quick moves into action:
- Download my free ebook 21 Titles That Turn Your Charts Into Data Stories. Better titles guide you to create the best chart for your audience to interpret data in less time.
- Set defaults in your visualization software, then change them as needed in specific cases. Have your entire team apply the same principles. Less “data ink” keeps the reader focused on what’s most important.
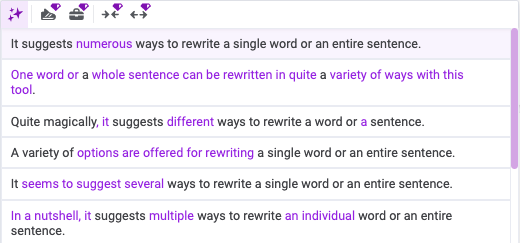
- Use the free Wordtune site or free plugin. It quite magically suggests a variety of ways to rewrite a single word or an entire sentence (as below).
Stop making excuses and start practicing brevity. It may take you more time at first, but that’s typical when you are learning something new. Stick with it!
How are you writing better in less time? Comment and let me know.
Best,
Lee
Rewriting How People See Data™
Frustrated By Low Dashboard Adoption?
Learn how to transform passive charts into action-oriented visuals.
